Geppetto basics
This section is your key to getting started with Geppetto. It will explain the Geppetto interface, loading projects, opening widgets, and running simulations. When you are finished reading this section, you will understand how Geppetto works and how to use it to explore a computational model.
- Learning the interface
- Dashboard
- Project workspace
Learning the interface
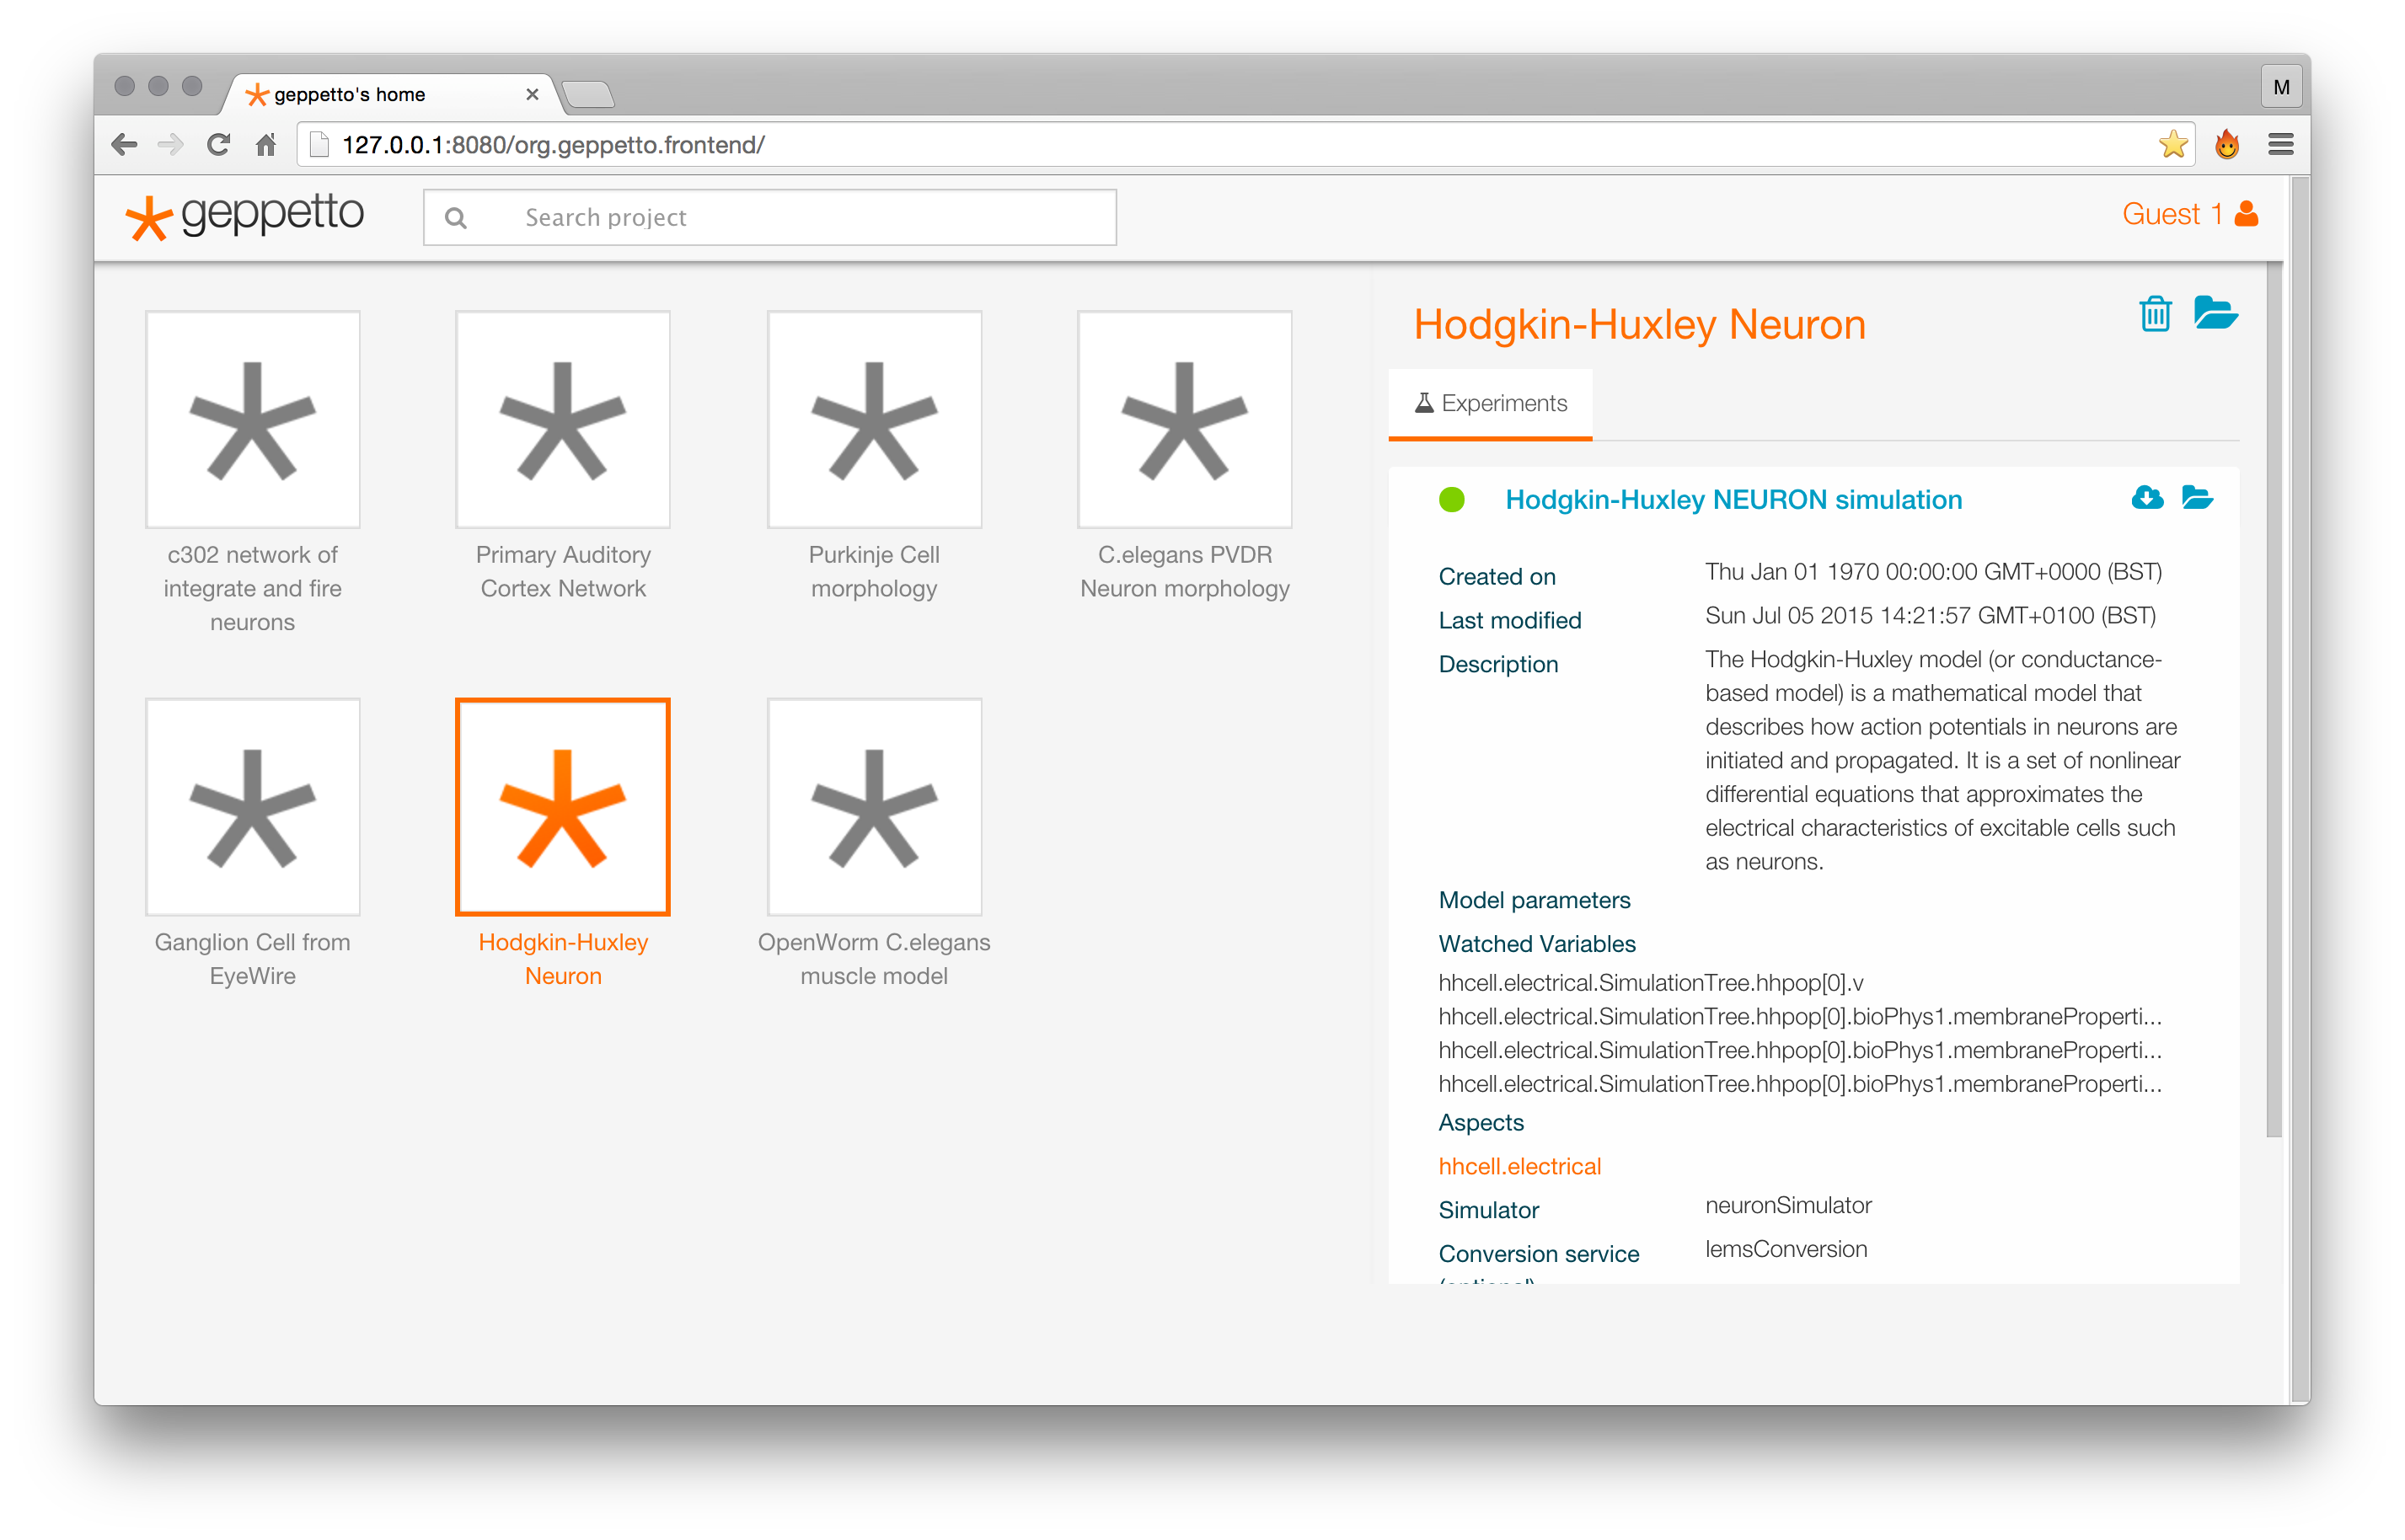
Geppetto has two main interfaces: the Dashboard and the Project workspace. The purpose of the dashboard is to easily view at a glance all the projects that are available to the user.
 image
image
Dashboard - In the demo deployment of Geppetto the dashboard shows some sample projects for a guest user.
Selecting a project in the left pane of the dashboard will reveal project details in the right pane. Double clicking on a project in the left pane will open the selected project in a new browser tab.
 image
image
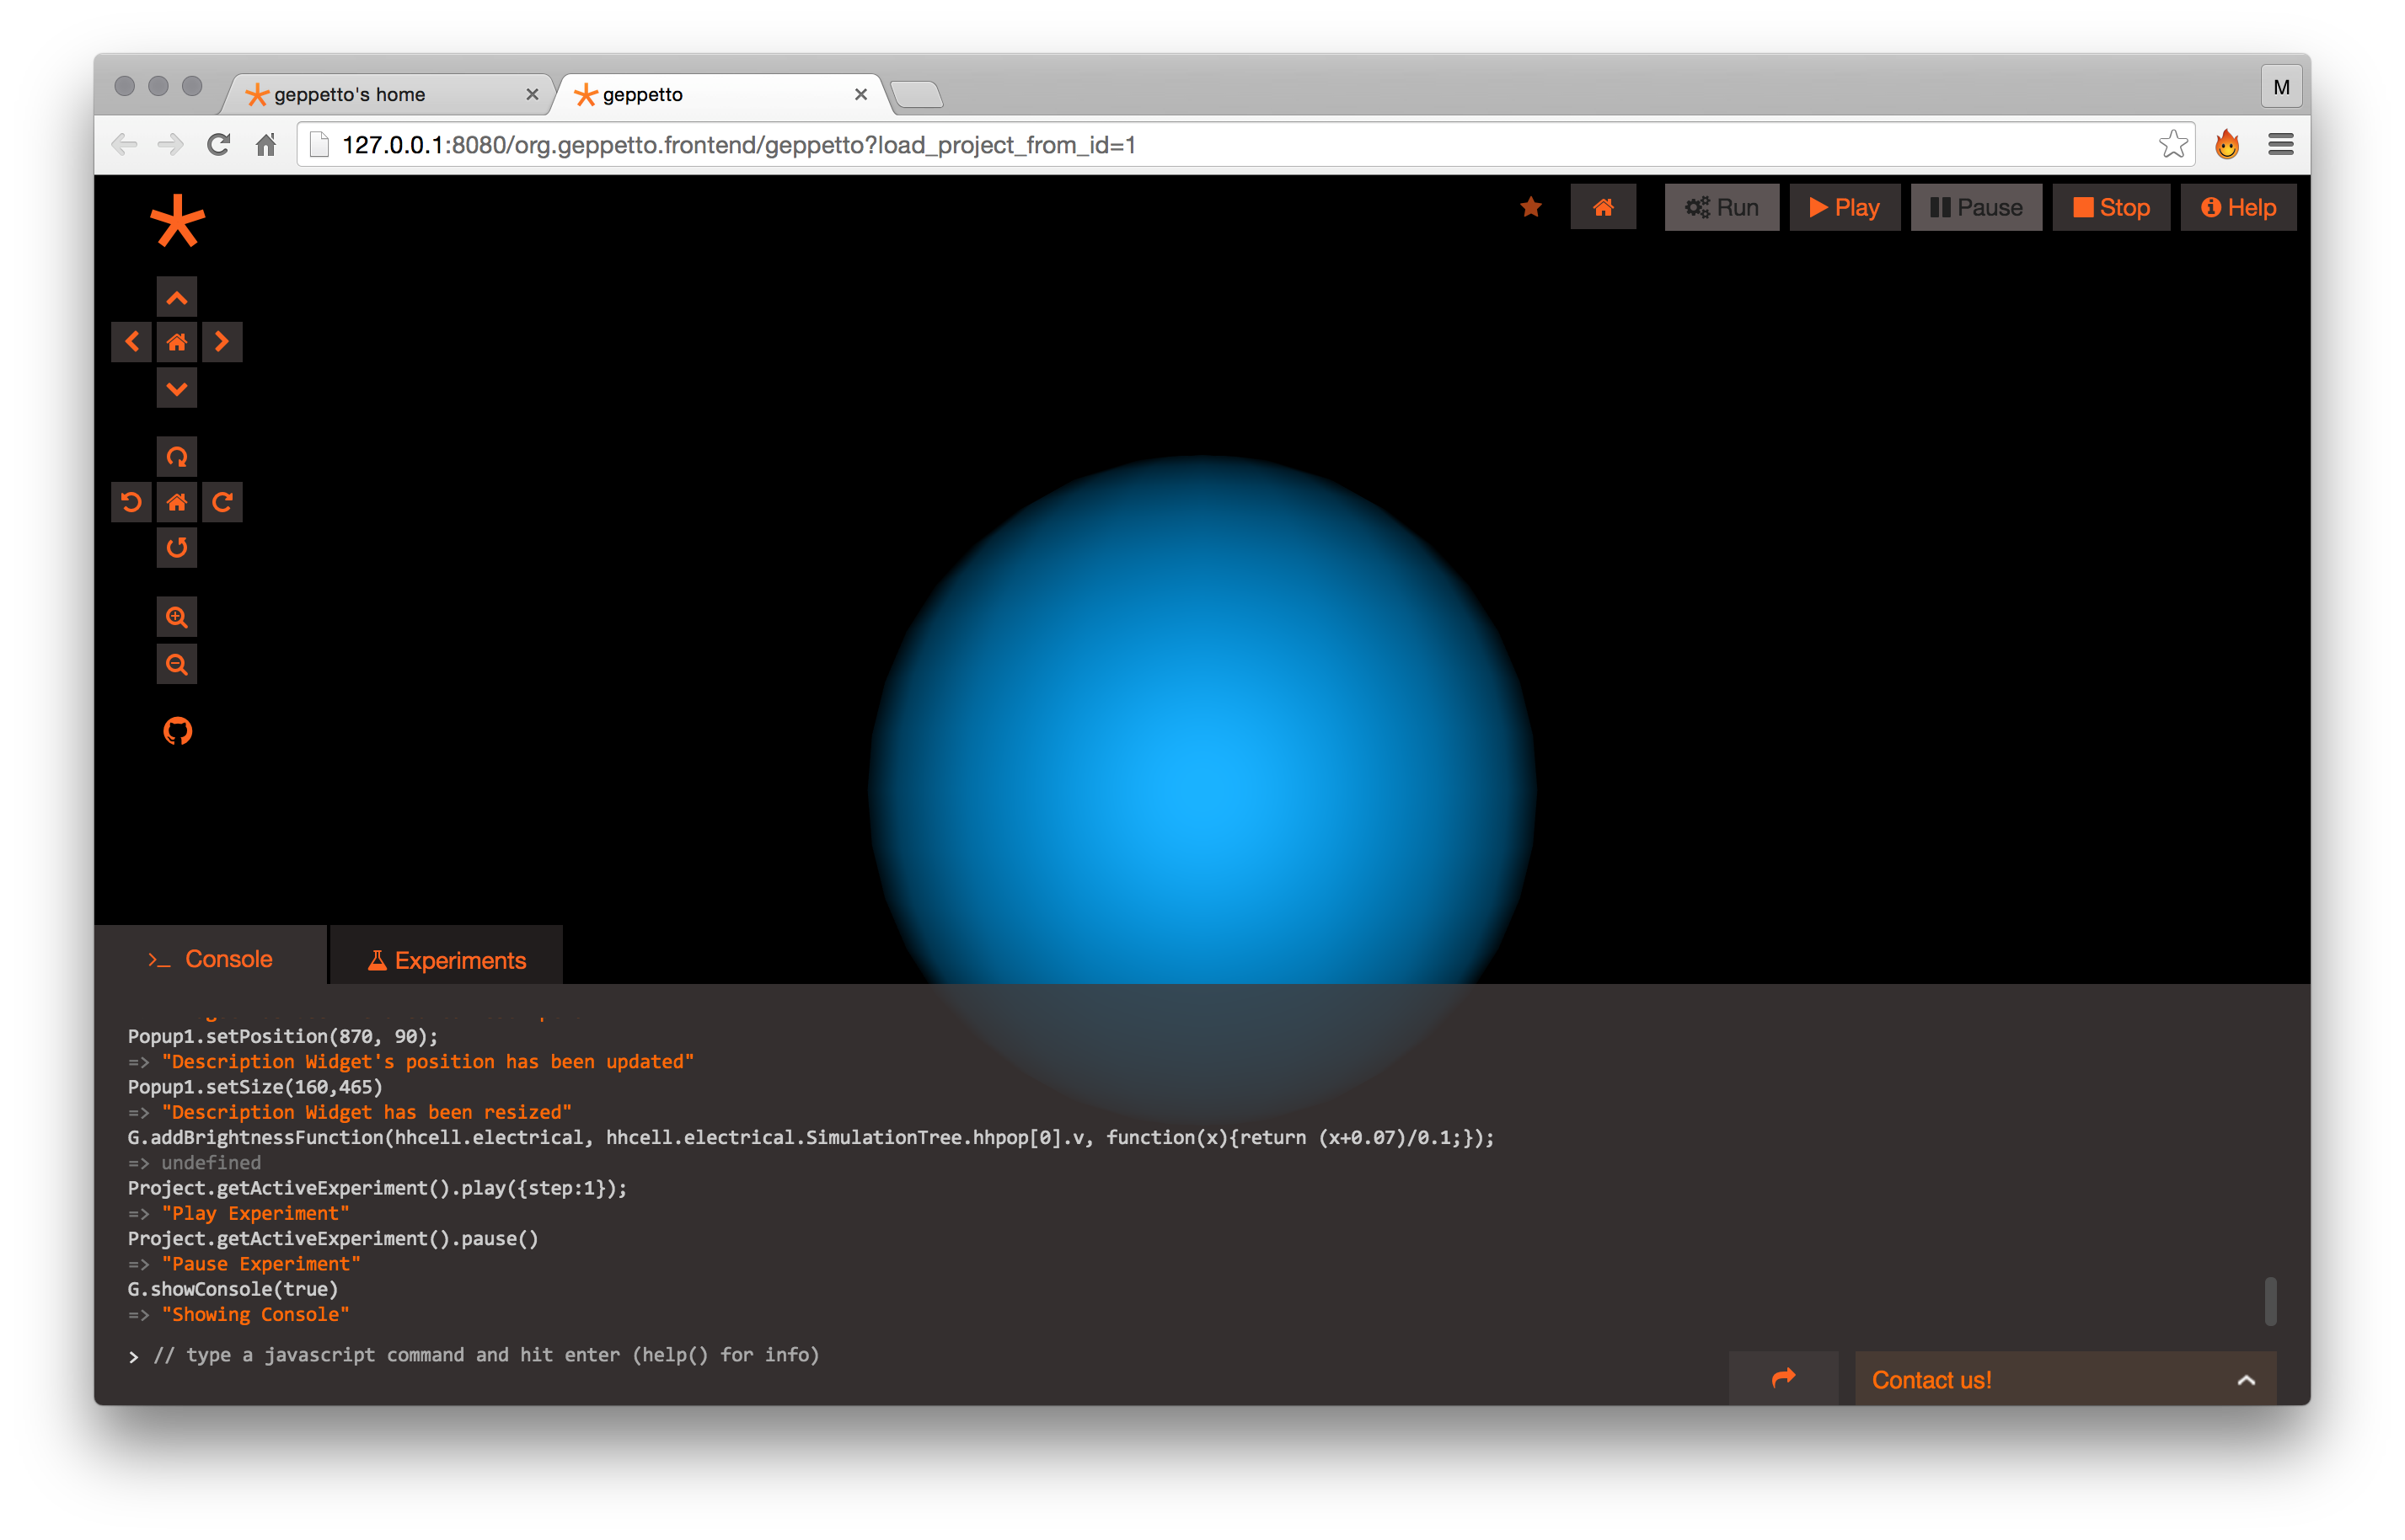
Project workspace - The project workspace is opened by double clicking on a given project in the dashboard. This view shows the morphologies, metadata and simulation data associated with a given project.
Dashboard
The dashboard is the main entry point to a Geppetto based application. The dashboard shows you which projects are available to you. The top right corner indicates which user is logged in for the current session. In the demo deployment of Geppetto this will read “Guest” because there is no persistence database behind it. Geppetto can be configured to work with user accounts.
Projects
Project
A Geppetto project contains the project metadata, information about the experiments, information about the state of the workspace and a link to the Geppetto model. For more details about how a Geppetto model is defined click here. A project allows you to perform multiple computational experiments on the model associated to the project.
The bar at the top allows you to filter the list of projects, just type in it to search for a specific one. The right pane shows which experiments are available in the selected project.
 image
image
Experiments
Experiment
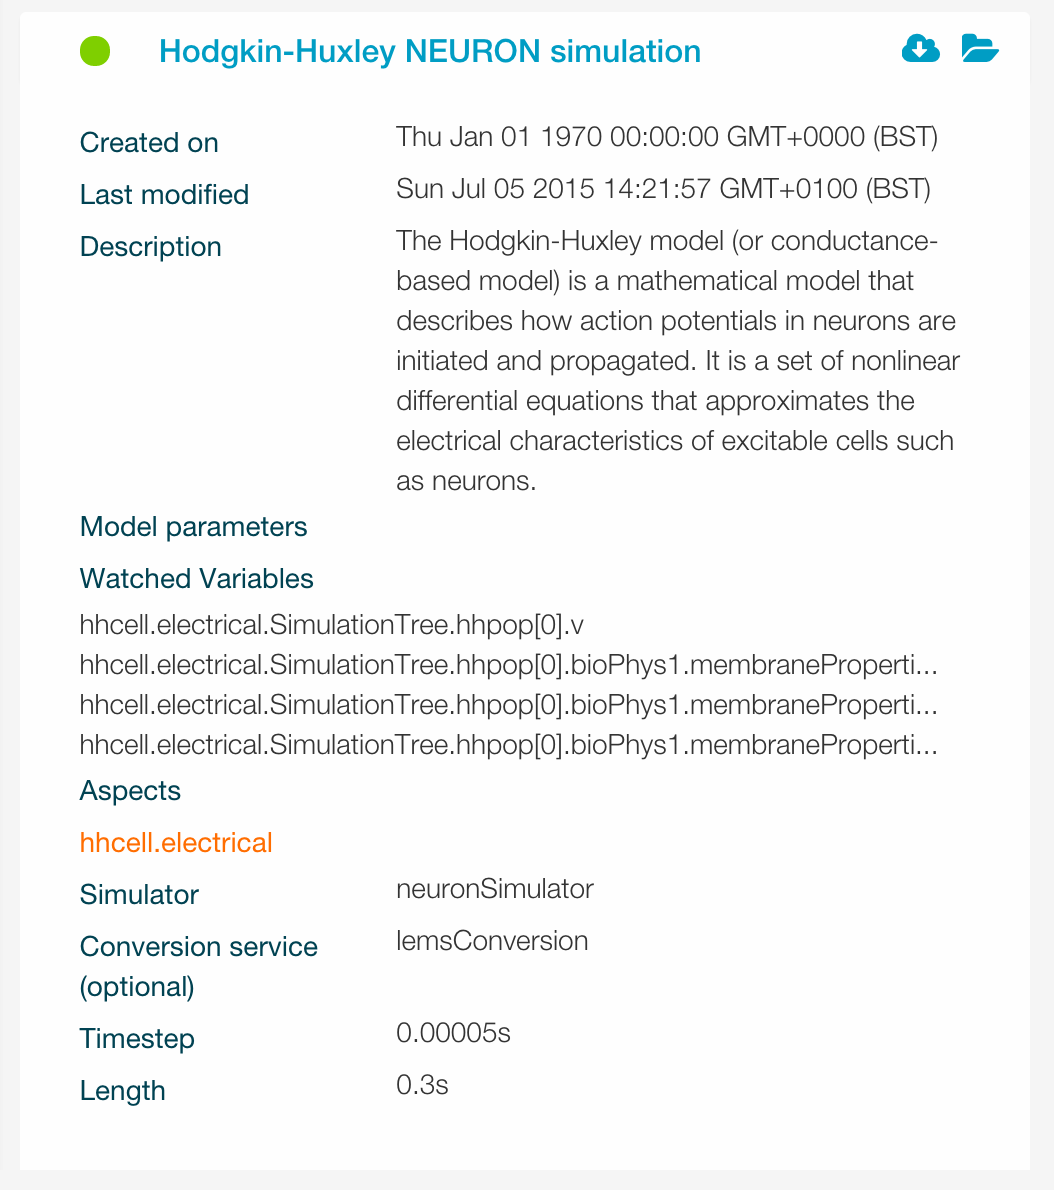
A computational experiment in Geppetto lets you specify what value you want to assign to the parameters available in your model and which variables you wish to record when you run a simulation of your model.
Recorded variables are called watched variables while the parameters are called model parameters. An experiment also allows you to specify the simulation parameters such as timestep, simulation length and which simulator to use in the given experiment. Watched variables and model/simulation parameters can be edited from the Project workspace (explained later in this tutorial).
An experiment can be in multiple states indicated by a different colour:
Design (Orange)
The experiment is in design state and editable. It is possible to select which variables are going to be watched when the experiment will run and set model/simulation parameters associated with it.
Queued (Blue)
The experiment simulation has been queued and will be executed by the Geppetto scheduler as soon as possible (depending on how many experiments are in the queue). From now on the experiment is “read only”, you can no longer add variables to the watch list or edit parameter values.
Running (Yellow)
The experiment simulation is currently being executed.
Complete (Green)
The experiment simulation is completed. It is now possible to replay it and visualize the simulation results. Experiment replay and model visualization are accessible from the Project Workspace view (covered later in this document).
Error (Red)
An error occurred while executing the experiment simulation.
Project workspace
Double clicking a project from the dashboard will open the project in the project workspace. The project workspace allows the user to visualize the models associated with the project, to create experiments and to simulate them with different available simulators.
The default experiment will be loaded when the project is opened, and it will be highlighted in the “experiments” tab of the console at the bottom of the screen. If there is more than one experiment for the current project, multiple rows will appear in the experiments tab. Clicking on the row will reveal experiment details and will let the user edit parameters.
Console interaction
 image
image
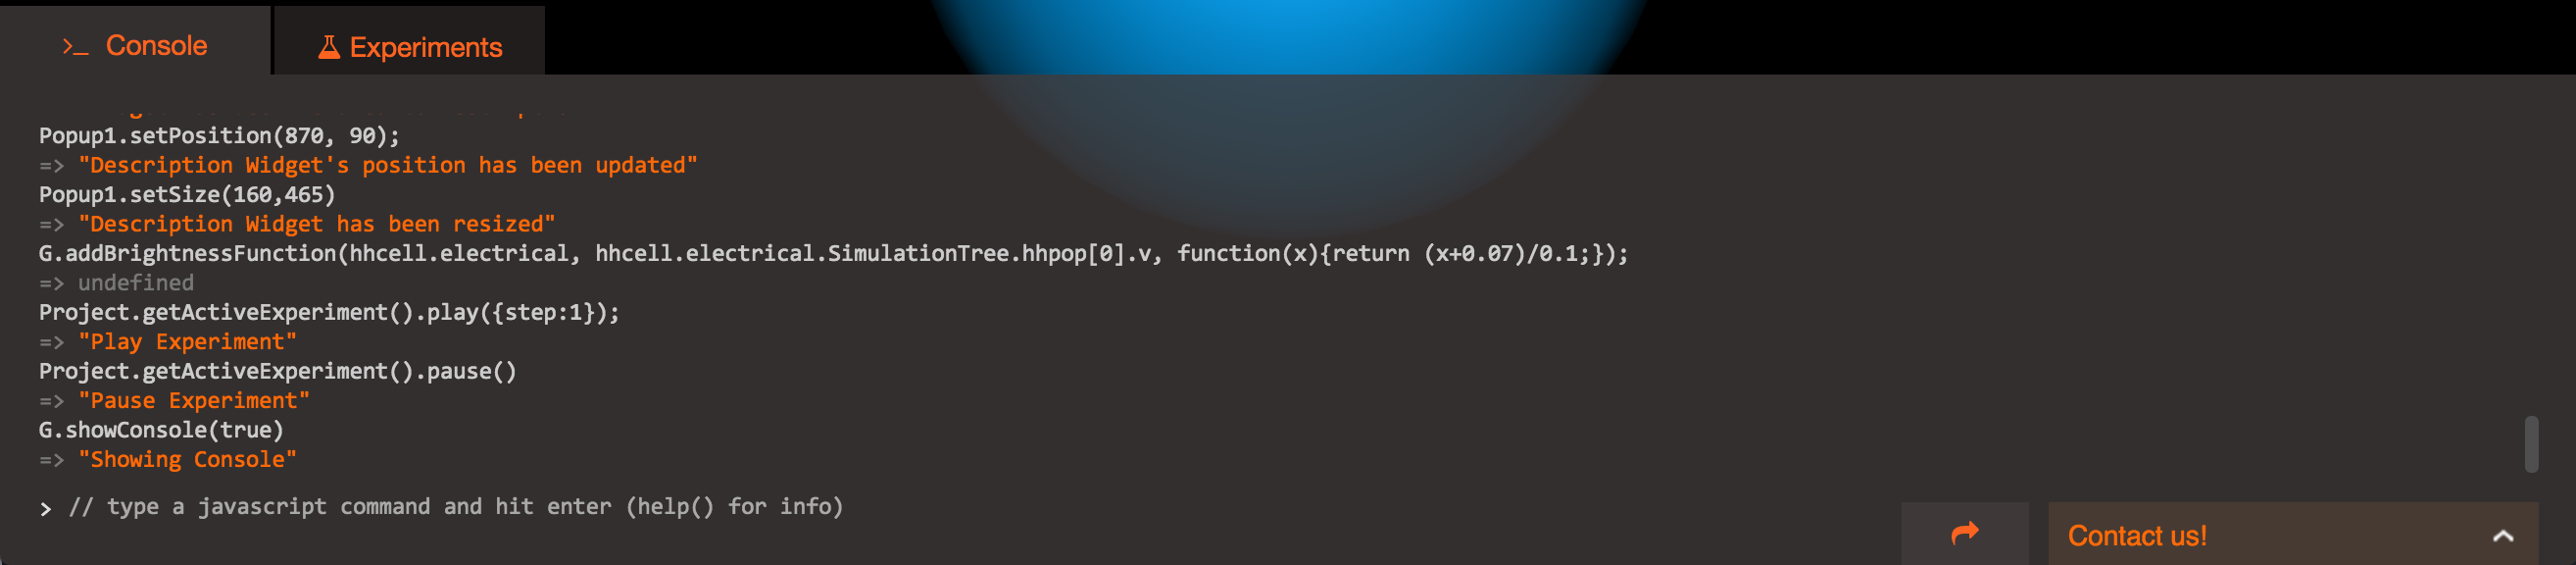
The console can be opened by clicking on the bar header at the bottom of the screen and is collapsed by default (once opened, clicking the bar header will function as an expand/collapse toggle). The environment is completely JavaScript scriptable and any action performed via UI interaction can be reproduced via the JavaScript console commands. Whenever the user interacts with the UI in the project workspace, the corresponding API commands will be printed in the console at the bottom of the screen (collapsed by default). Playing with the UI and looking at the console is an easy practical way to learn more about the Geppetto JavaScript API. The console history can be easily exported to text file.
Model visualization
Morphologies: When an experiment is loaded (upon opening a project the default experiment is loaded), if a 3D representation of the model morphology is available it will be immediately visualized in the 3D canvas (the main area of the screen). The user can interact with the 3D canvas and the scene in it representing the model with intuitive mouse movements: dragging around with left button for rotation, right button for panning and mouse wheel for zooming. The camera controls are also available on the top-left bar, including buttons for rotation, panning and zooming. Upon loading, Geppetto will make an attempt at centering the model based on its initial geometries. The control bar also has a “home” button that will bring the model back to the initial centered position.
Using widgets
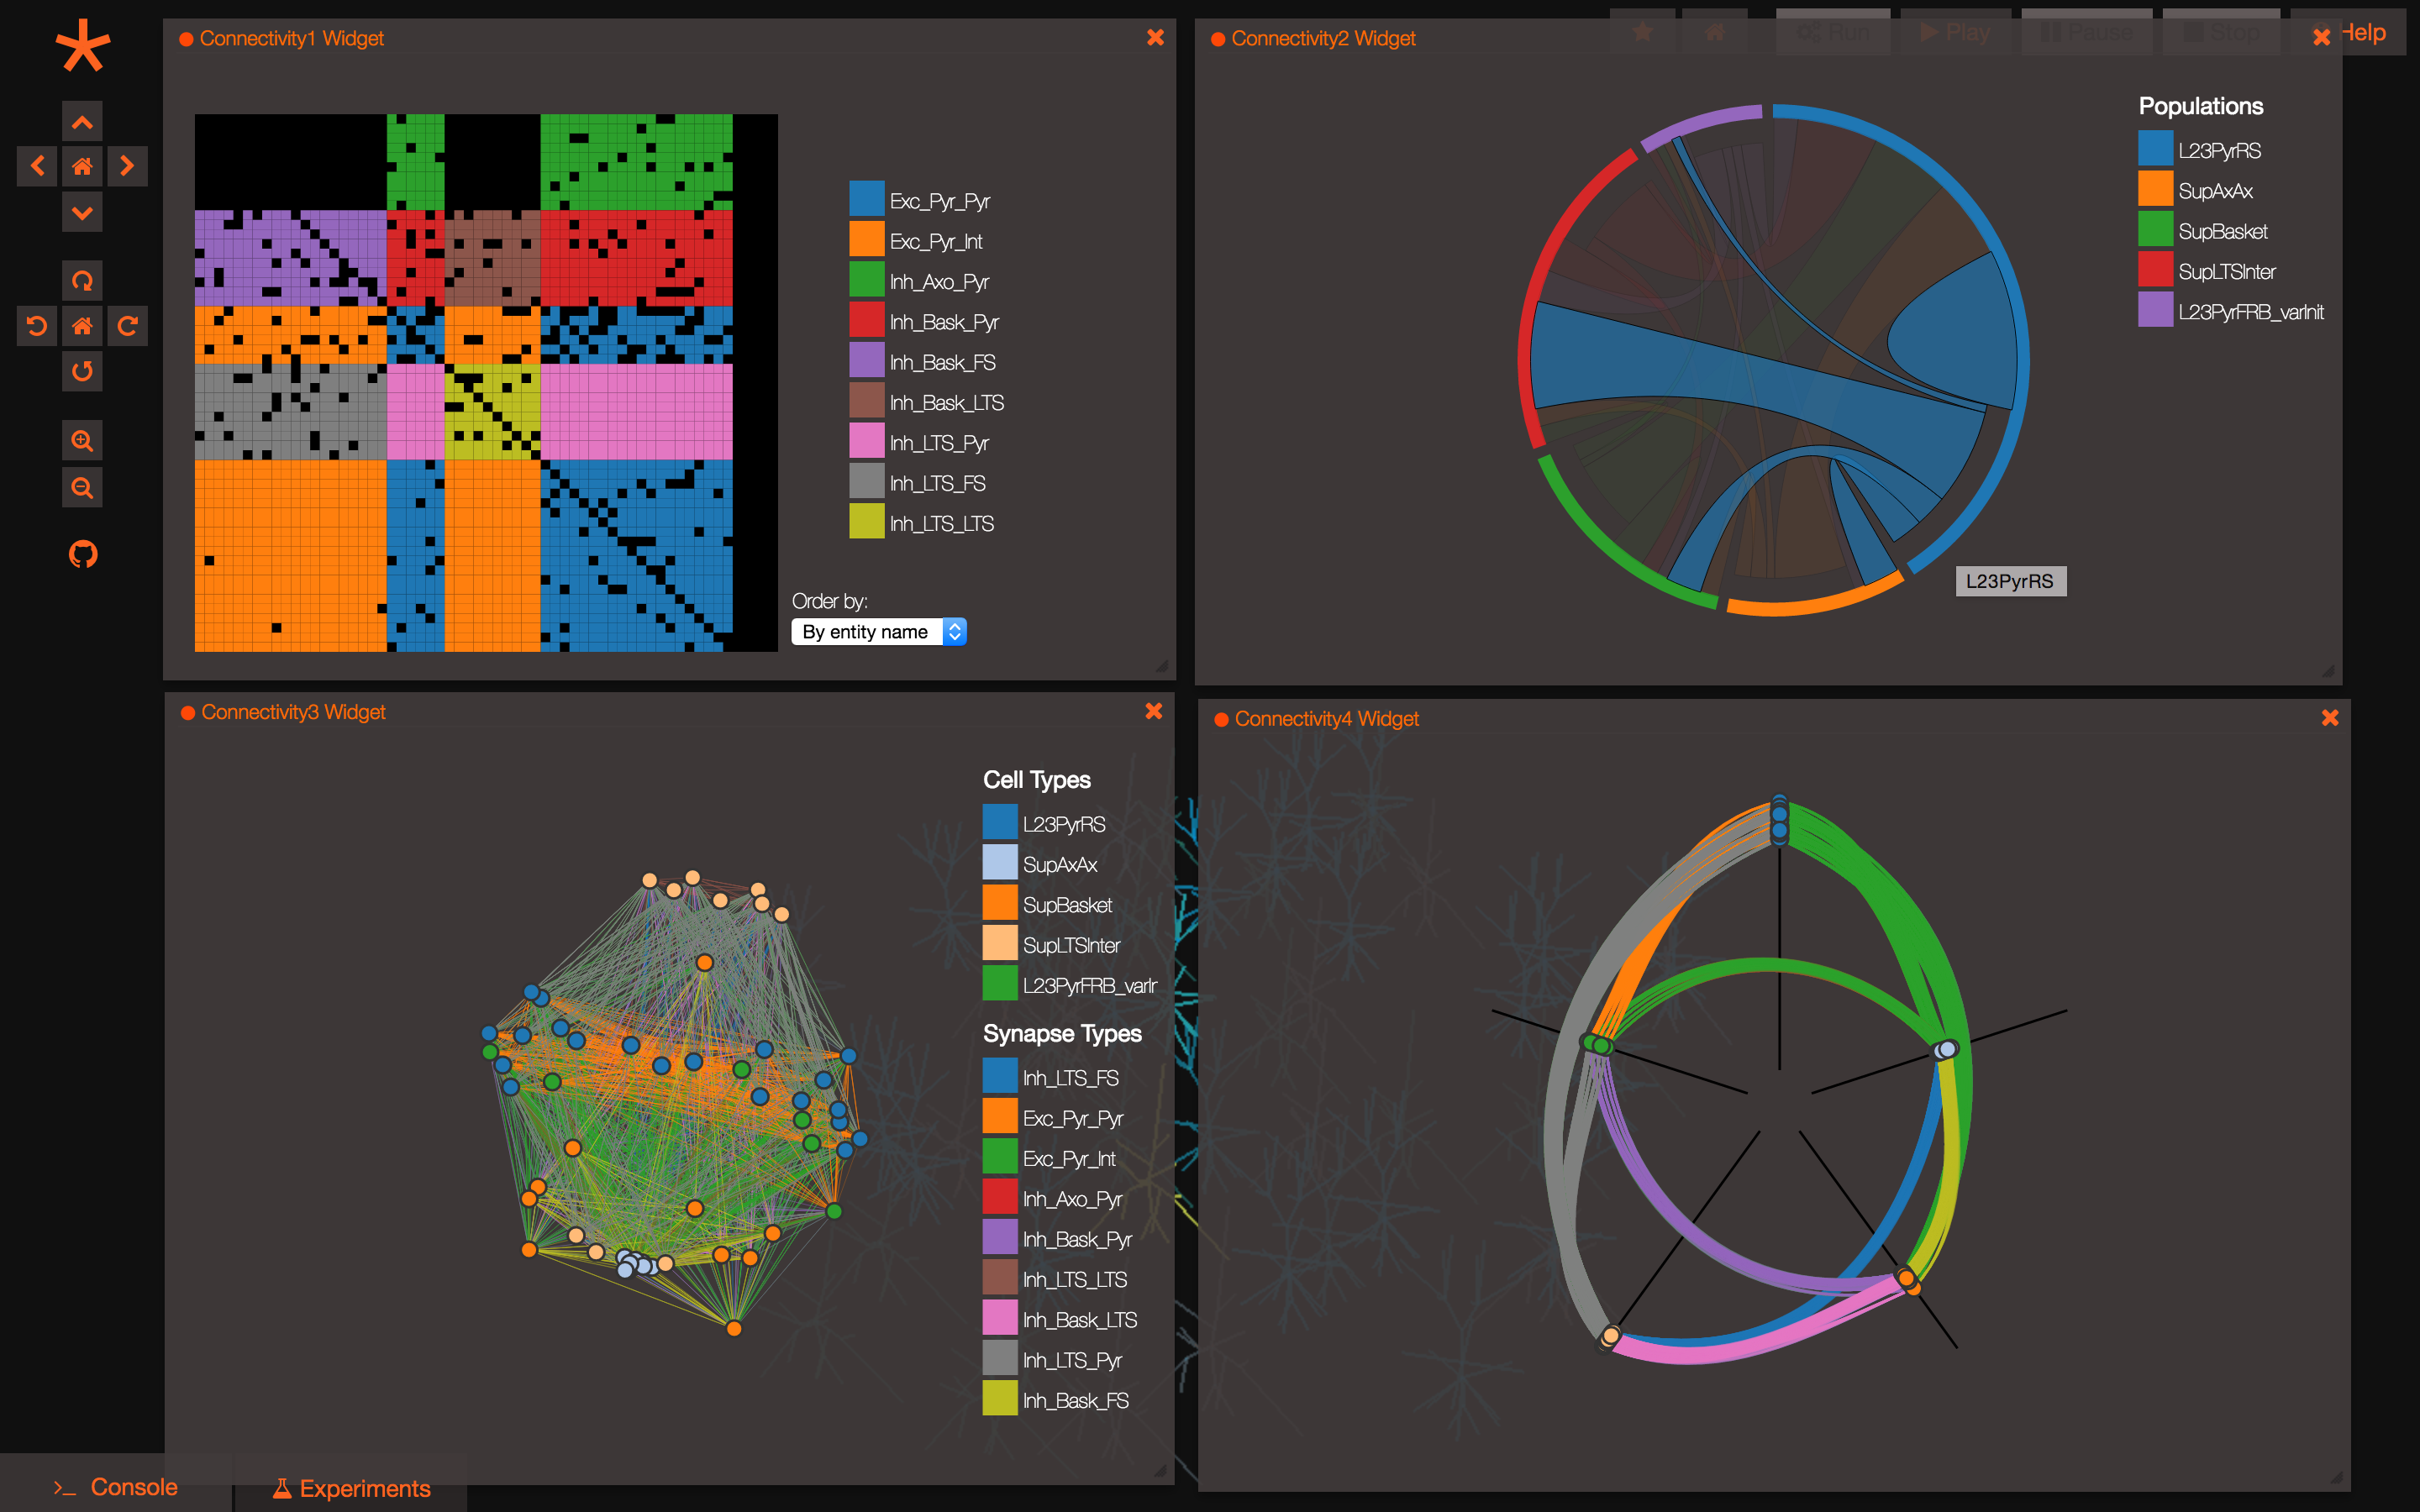
Model metadata can be visualized with various Geppetto widgets. The tree widget is particularly useful to visualize Geppetto entity hierarchies.
 image
image
In addition, a connectivity widget (shown above) is particularly well suited to explorations regarding model neuronal networks.
How to use Geppetto widgets is covered in detail here.
Lightspeed Search
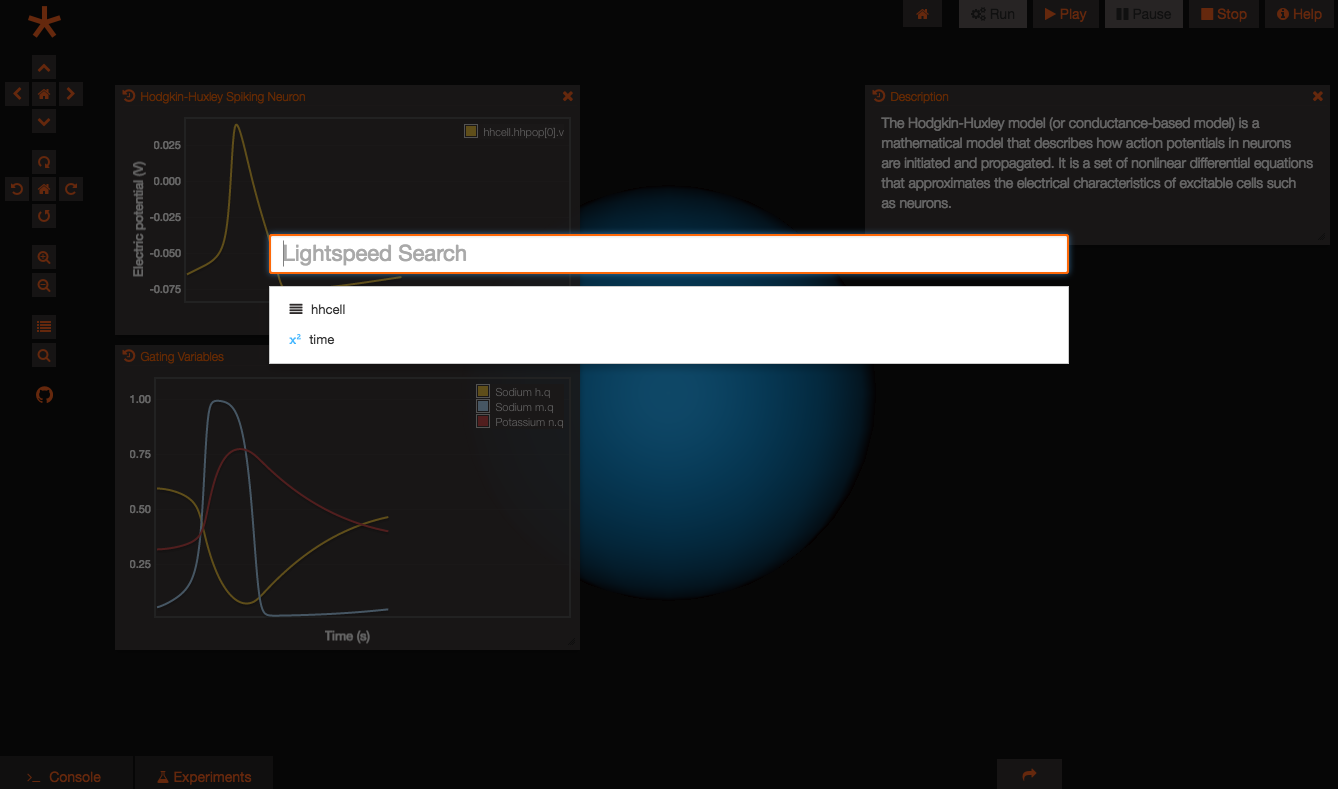
Geppetto has a search feature that allows the user to search for anything in the scene / simulation and to interact with it. The search can be opened with the CTRL+SPACE shortcut or by clicking on the magnifying glass icon on the left side bar (located right under the camera controls), while it can be closed by simply press ESC.
 image
image
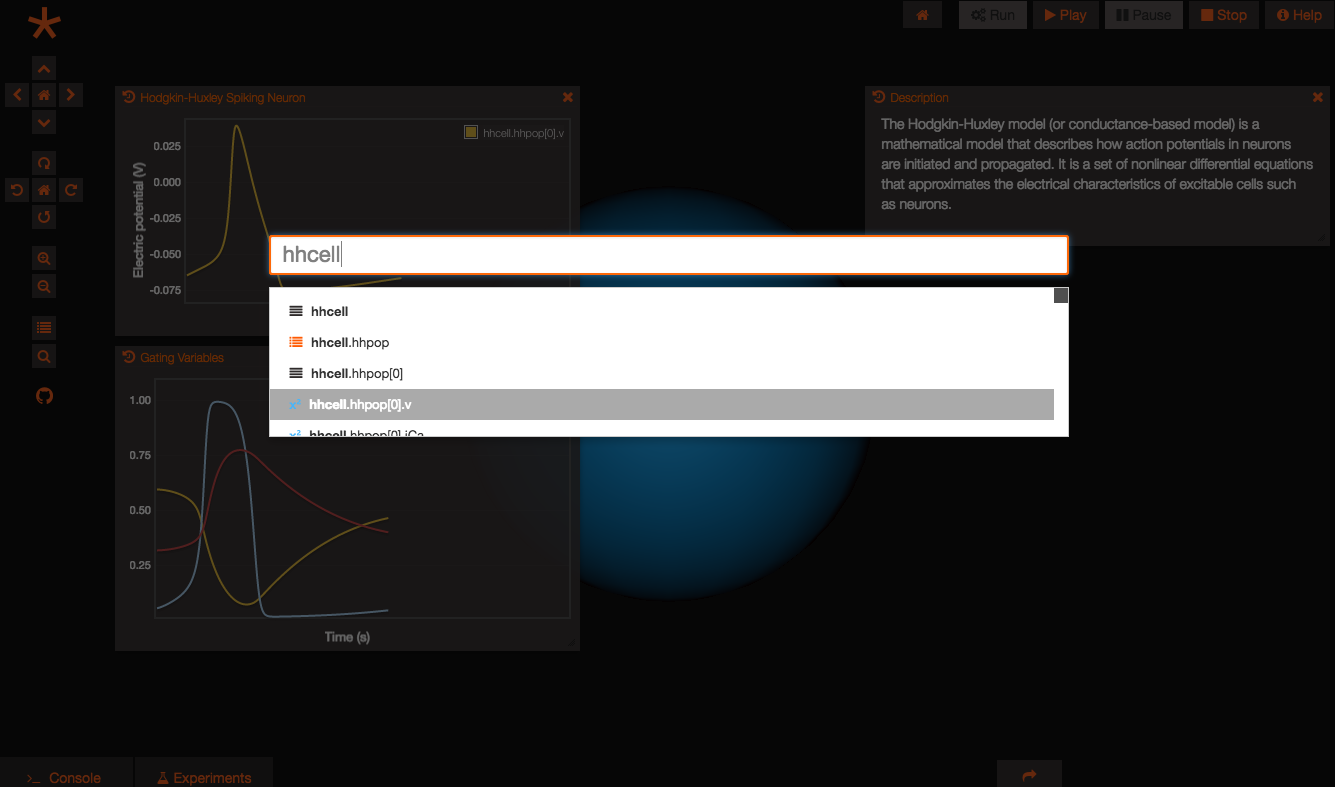
To use the search bar after bringing it up, simply type in the text box, or pick from the default options available under the text box (usually representing the visible elements in the scene). The box will give suggestions in the list below as the user types.
 image
image
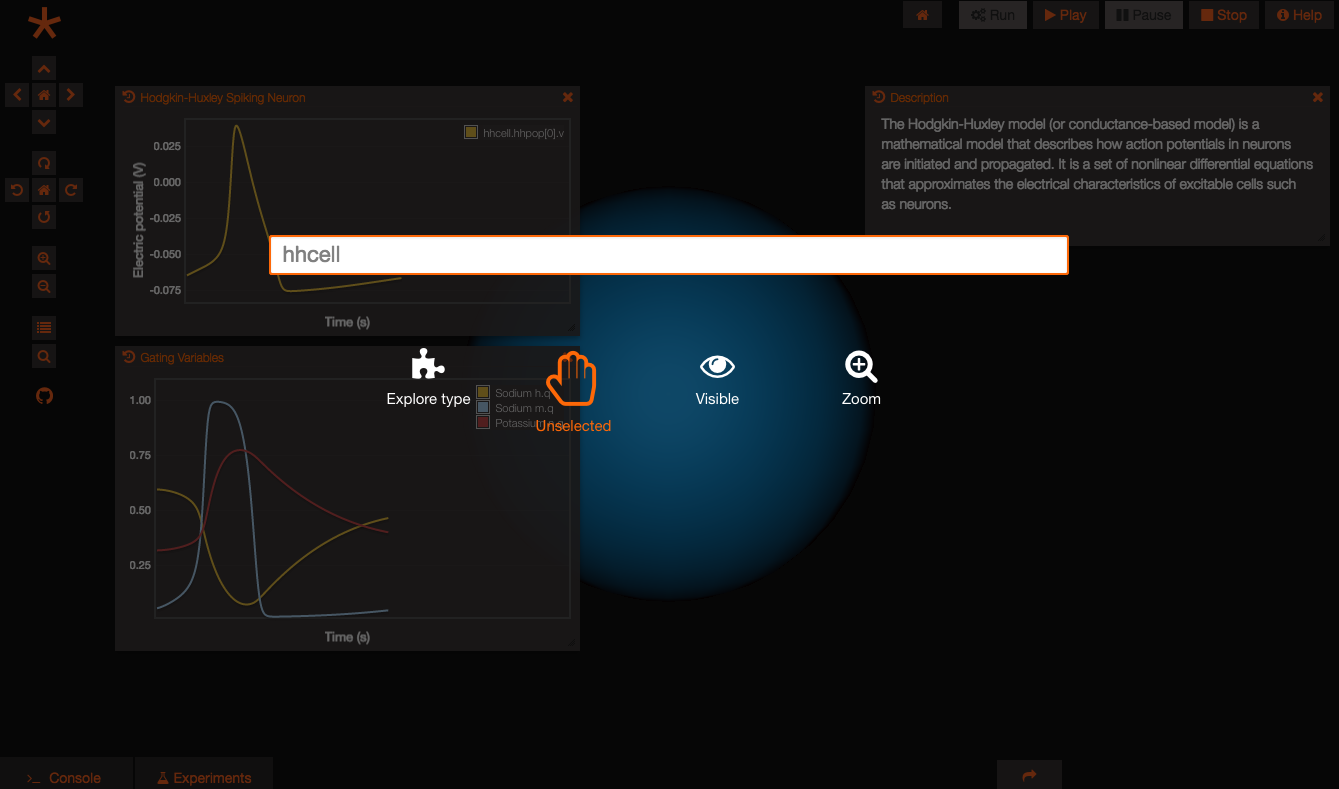
Once an entity has been selected by the user (by clicking on the list options, or typing and then pressing enter), icons with possible actions for that entity are shown below the text box (e.g. if it’s a state variable the user can plot it, if it’s a visual entity the user can select it or zoom on it etc.). The tooltip on the icons lets the user know what the icon means.
 image
image
The lightspeed search is also configurable via its API, for example to show a list of suggestions to the user that can be mapped to scripted actions. This will be covered in the developer documentation.
Control Panel
The Geppetto control panel gives a tabular view of all the entities in the scene, and provides controls to perform actions on them. The control panel can be opened with the “rows” button under the camera controls on the left side bar, or via the CTRL+P shortcut. It can be closed with the ESC key.
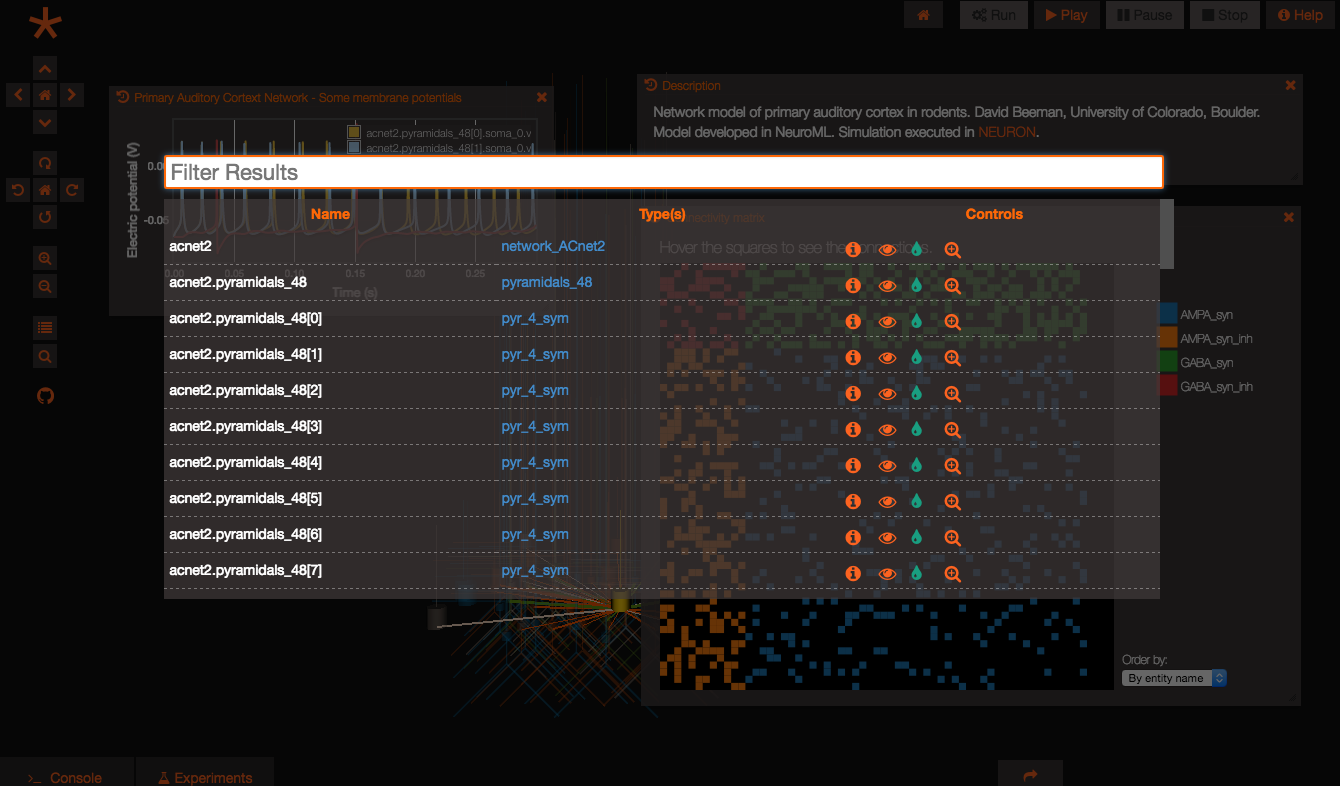 image
image
The user can filter results with the text box at the top of the grid (only the rows with matching text will be shown), and apply sorting by clicking on the column headers.
The control panel shown in the screenshot above is the Geppetto default, with info, selection, zoom, and color controls, but it can be completely customized via the API (covered in the developer documentation).
New experiment
New experiments can only be created if the persistence bundle of Geppetto is installed in a given deployment (note: this is not the case on the live.geppetto.org demo).
A new experiment can be created by clicking on the “+” button visible at the top right of the experiments tab, and a row will be added to the experiments table. Editable fields can be edited by clicking on them.
Once the experiment is created the user can:
- Edit the experiment name by clicking on it
- Expand experiment details by clicking on the experiment row
- Edit simulation parameters from the experiment details (by clicking on the fields, same as the name), once the row is expanded. (i.e. Simulator –> neuronSimulator Time step –> 0.00005s Length –> 0.3s)
- Add simulation variables to the watch list (*). This will cause simulation values to be recorded. Without watching any variables nothing will be recorded, so it is useless to run an experiment without any watched variables.
(*) At the moment the only way to add variables to the watch list is via the console, using the Geppetto JavaScript API.
Simulate experiment
Once parameters have been set, the experiment can be run by clicking the “run” button, the button with cogs in the top-right control bar. This will cause the experiment simulation to be placed on the Geppetto scheduler queue. The colored circle on the experiment table will indicate the experiment status. Statuses are explained in the “Experiments” section above.
Replay experiment
Once the experiment status goes to green, the experiment can be replayed by clicking the “play” button on the top right control bar. When the experiment is replayed, simulation results for the watched variables are streamed to the client in the form of a Geppetto recording, but this is entirely transparent to the user. A common way to visualize simulation results are plot widgets, tree widgets and value widgets, so the user will typically add the desired widgets to the Geppetto frontend and set the desired “data sources” before hitting “play”. More on widgets and how to instantiate them here.