Connectivity Widget
The Connectivity Widget provides different ways to visualize connections
between model entities. Data is bound to the widget by invoking the
setData(entity[, options]) method. The way information is displayed is
controlled via the layout field in the options object. Currently,
four layouts are supported:
- ‘matrix’ (default): Connectivity Matrix_
- ‘force’: Force-directed layout_
- ‘hive’: Hive Plot_
- ‘chord’: Chord Plot_
Each one of the options is detailed below.
Layout agnostic options
After creating an instance of the Connectivity widget with
G.addWidget(GEPPETTO.Widgets.CONNECTIVITY), data must be bound to it
using the setData() method, which applies to any of the layouts.
Additional options for the same method can be used to control visual
attributes – such as mapping link/node categories onto colours or node
weights onto line widths – in the following manner:
The setData(entity[, options]) method accepts two arguments:
- entity (mandatory): the entity whose connections will be plotted.
- options (optional): an object, containing one or more of the
following keys:
- layout: one of [‘matrix’, ‘hive’, ‘force’, ‘chord’]. Defaults to ‘matrix’.
- library: a Geppetto library, e.g.
GEPPETTO.ModelFactory.geppettoModel.neuromlthat supplies anetworktype. - linkType: a function that maps each connection edge (object
of class
ConnectionNode)
onto any type of value (coercible to string) which
qualitatively identifies the link category. Defaults to
function(link): {return 1}(i.e., all links are of same ‘type’ 1). Applies to matrix, force, hive views. - linkWeight: a function that maps each connection edge
(object of class
ConnectionNode)
onto a Floating point number, which represents the
connection weight. Defaults to
function(link): {return 1}(i.e., all links are of same ‘weight’ 1, and will be e.g. be drawn as lines with the same width in the force view. - nodeType: a function that maps the connection source node
(object of class
EntityNode )
onto any type of value (coercible to string) which
qualitatively identifies the node category. Defaults to
function(node): {return node.getId().split('_')[0]}(i.e., nodes are classified according to part of their ‘id’ field before the first ‘_’ character). Applies to force, hive views. - colorMapFunction: a function returning a d3
scaleOrdinal,
called when a
Color_setevent is raised.
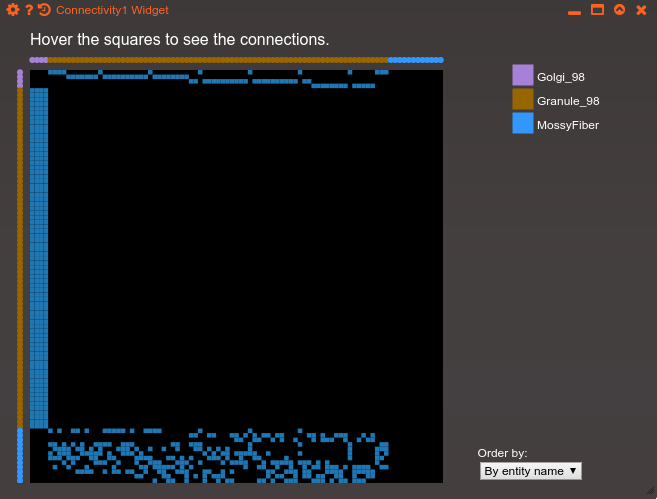
Connectivity Matrix
Draws a square matrix, where each row [column] correspond to a source [target] node. Therefore, filled squares at i,j denote a directed edge from node i to node j. The rows/columns can be sorted by node name, number of incoming connections, and number of outgoing connections. Circles above each row/column indicate the type of nodes in that row/column. Hover over to see node or type names, click to select the corresponding cells in the Geppetto 3D view.
Example 1
Connectivity widget for a cerebellar granule cell layer model. It defaults to a vanilla matrix if no options are specified:
G.addWidget(GEPPETTO.Widgets.CONNECTIVITY).setData(network_GranCellLayer);
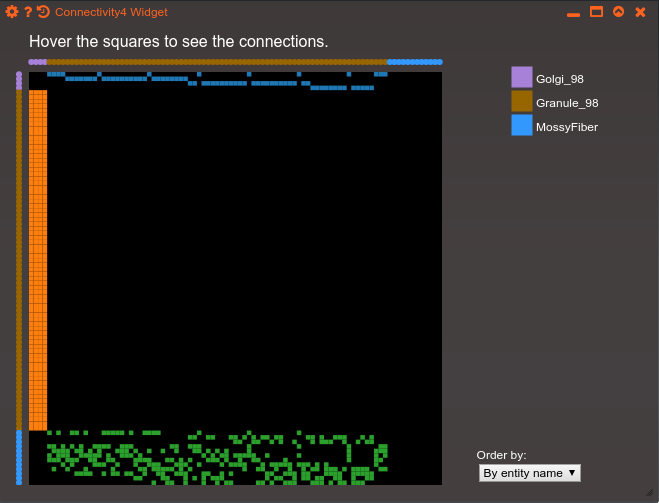
Example 2
Using the linkType option to colour links (synapses) by neurotransmitter in a model of the auditory cortex. The linkType function leverages the getAllVariablesOfType method, in order to get NeuroML synaptic properties, which in turn have and id attribute which indicates the neuromodulator (and the population, which is irrelevant in this case). The name is finally split at the underscore to get only AMPA/GABA. :
G.addWidget(GEPPETTO.Widgets.CONNECTIVITY).setData(MediumNet,
    {linkType: function(l) {
                   var synapseType = GEPPETTO.ModelFactory.getAllVariablesOfType(l.getParent(), GEPPETTO.ModelFactory.geppettoModel.neuroml.synapse)[0];
                   if (synapseType != undefined)
                       return synapseType.getId();
                   else
                       return l.getName().split("-")[0];
               }
    });
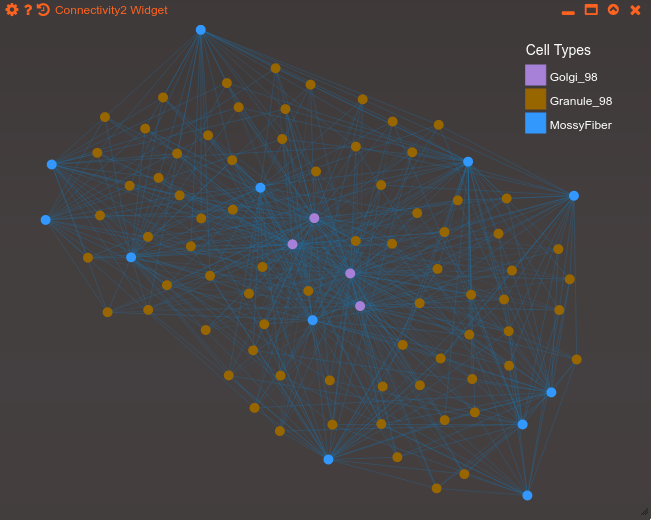
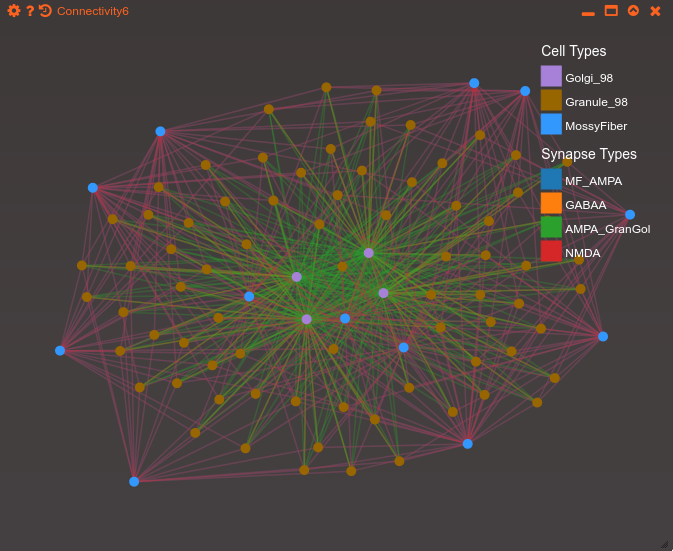
Force-directed layout
Draws circles for each node, connected by lines for each edge. Node / link colours and line widths can be customized via the nodeType, linkType, linkWeight mappings respectively. Nodes repel each other (force directed) in order to reduce clutter, and can be interactively dragged. Hover over to see the node name.
Example 1
Default force layout for the cerebellar granule cell layer model. :
G.addWidget(GEPPETTO.Widgets.CONNECTIVITY).setData(network_GranCellLayer, {layout: 'force'});
Example 2
Using the linkType option to colour links (synapses) by neurotransmitter and the linkWeight option to scale line widths based on the synaptic base conductance level (which is NOT physiologically meaningful, but is used here just for illustrative purposes). :
G.addWidget(GEPPETTO.Widgets.CONNECTIVITY).setData(network_GranCellLayer,
    {layout: 'force',
     linkType: function(l) {
                   var synapseType = GEPPETTO.ModelFactory.getAllVariablesOfType(l.getParent(), GEPPETTO.ModelFactory.geppettoModel.neuroml.synapse)[0];
                   if (synapseType != undefined)
                       return synapseType.getId();
                   else
                       return l.getName().split("-")[0];
                 }
     });
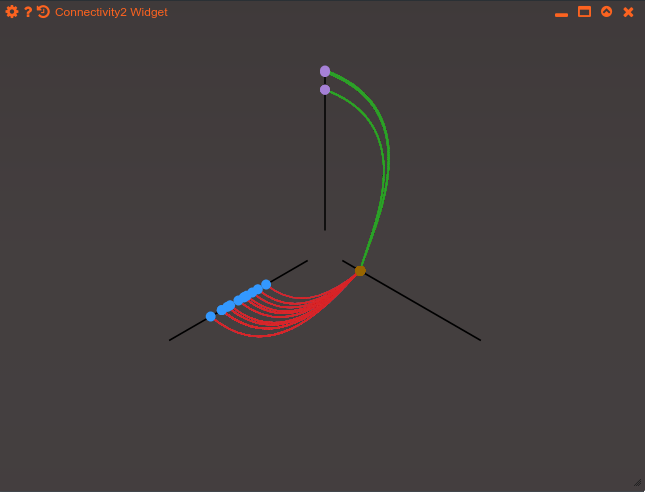
Hive Plot
Depicts connectivity using a hive plot. Nodes are segregated by type into axes arranged radially, and edges are represented by lines. The position of a node in each of the axis is given by the node degree (indegree + outdegree for directed graphs, which is always the case in Geppetto).
Example 1
Hive plot for the cerebellar granule cell layer model. Link colours are customized via the linkType mapping. :
G.addWidget(GEPPETTO.Widgets.CONNECTIVITY).setData(network_GranCellLayer,
    {layout: 'hive',
     linkType: function(l) {
                   var synapseType = GEPPETTO.ModelFactory.getAllVariablesOfType(l.getParent(), GEPPETTO.ModelFactory.geppettoModel.neuroml.synapse)[0];
                   if (synapseType != undefined)
                       return synapseType.getId();
                   else
                       return l.getName().split("-")[0];
               }
    });
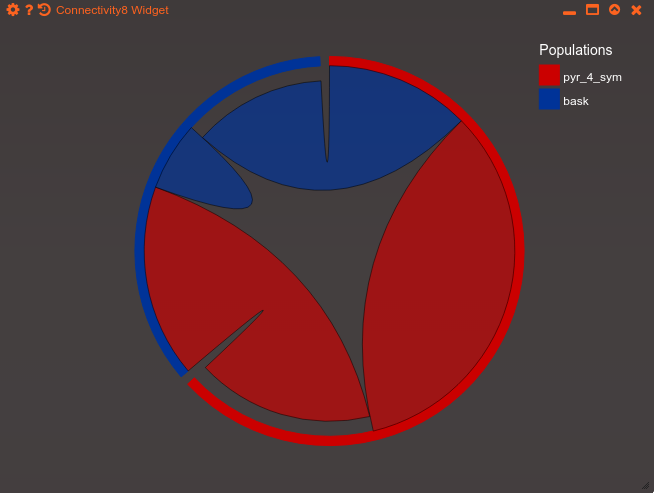
Chord Plot
Draws populations as arcs of a circle, with connections represented as “chords” between populations. The arcs at the extremities of each chord indicate the number of nodes in each population projecting to the reciprocal population. Based (but using different conventions) on Circos.
Example 1
Default chord layout for the auditory cortex model. :
G.addWidget(GEPPETTO.Widgets.CONNECTIVITY).setData(MediumNet, {layout: 'chord'})